Case study 03 · Deaku, AI-native creator workspace
The first metrics layer, from a revenue goal to design metrics
Target
The company’s revenue target, with a first checkpoint
Revenue lines
- Self-serve · product funnel
- Teams · sales-led
- Partners · sales-led
North star
Weekly active collaborating workspacesTwo or more members, and at least one comment or review action that week
Drivers
1
Visits
The founders’ lane
2 · collapse point
Sign-up start
CTA click rate · section reach
3 · collapse point
Mobile sign-up
Phone vs desktop start rate
4
Activation, 48 h
Time to value · checklist completion
5 · collapse point
Retention, 4 weeks
Invite-sent rate · solo vs team retention
6
Free to paid
Prompt shown to clicked · limit hit to upgrade
- Role
- Product engineer: metric design, data analysis, hypotheses, presentation
- Team
- Two founders, founding technical lead, me
- Timeline
- September 2026 · about three working days, spread over a month
- Tools
- Product event tracking, Web analytics, Claude Code research agent
Key results
- A KPI tree from the revenue target down to design metrics, with one north-star metric
- The first baseline of the funnel, showing where visitors and new users drop off
- Plan accepted: I now own the metrics, the tracking and the dashboard
Context
The founders bring users in. My job is to make sure they stay.
Deaku is an early-access workspace for creators and their teams. The company watched sign-ups, paid accounts and revenue. The product was collecting events, but nobody had defined which numbers mattered in between, or read them as a funnel.
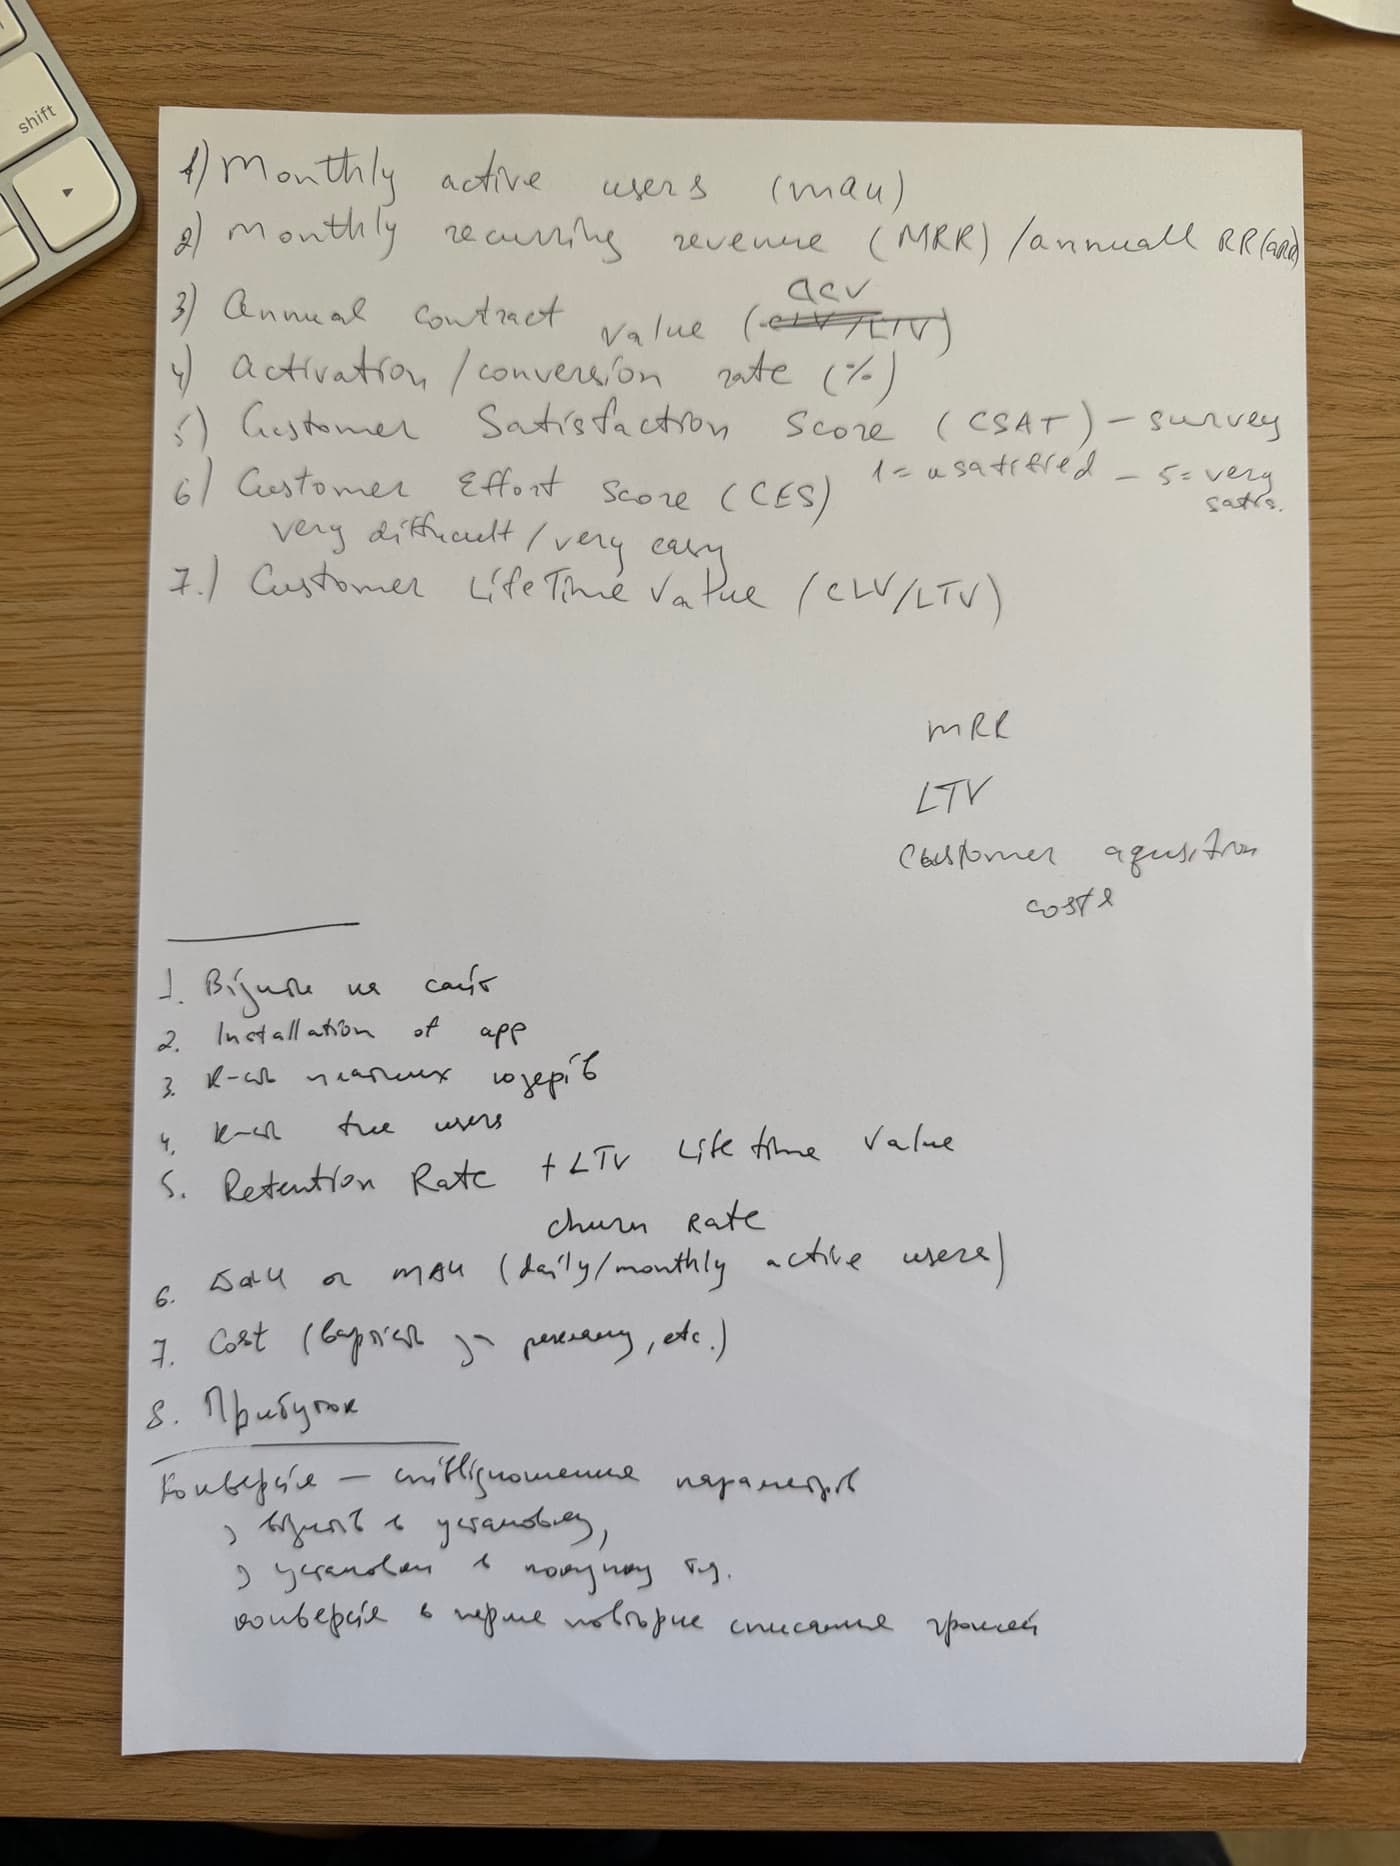
I raised it, and started with a hand-written list of about fifteen candidate metrics and one question: which of these matter, and how do they connect? It took about three working days, spread over a month alongside my other work, and gave the company its first measurement layer.
Me
Metric design, analysis, hypotheses, presentation
Two founders
Target, plans, decisions
Founding technical lead
Added the event tracking
The problem
A revenue goal with nothing underneath it.
- No target the metrics could ladder up to. The revenue goal existed, but it had never been connected to how people use the product.
- No agreed numbers between sign-up and payment. Activation, retention and usage had no definition and no baseline.
- The tracking that existed had gaps. Only some entry points were measured, and one event watched an element that no longer existed.
01 · Choose
A metric earns its place if it changes a decision.
I filtered the list with one test. Most of the list failed it at this stage of the company.
The test: if this number moved, would we do anything differently?
Dropped
- Satisfaction score
- Effort score
Too early for the number to mean anything
Deferred
- Lifetime value
- Acquisition cost
- Annual contract value
Not enough history to calculate them yet
Replaced
- Monthly active users
- Daily active users
A solo user being active isn’t the product working. The north star took their place
Kept
A six-step funnel
1
Visits
2
Sign‑up start
3
Mobile sign‑up
4
Activation
5
Retention
6
Free to paid
02 · Connect
From the revenue target down to design metrics.
Draft, don’t ask. I took the target from the company’s own business and sales plans, reconciled them where they differed, and drafted a specific target and north star for the founders to react to. They agreed with both.
The north star: weekly active collaborating workspaces. The product is sold to teams, so a workspace only counts when two or more people are in it and someone has commented or reviewed that week.
03 · Measure
Getting the first numbers.
Earlier in the year I made the case that we needed measurement, and the founding technical lead added event tracking to the product. So by the time I built the tree there were several months of data to read. I read it through a research agent with read-only access, alongside the web analytics, and I’m now refining the tracking so every driver in the tree can be read.
04 · Baseline
Six drivers, and where the numbers collapse.
1None
Visits
The founders’ lane: marketing and sales
2 · collapse pointDeep
Sign-up start
4 in 100
visitors start sign-up. 7 in 10 of them finish
3 · collapse pointDeep
Mobile sign-up
1 in 7
sign-up starts is on a phone, though a third of visitors are
4Medium
Activation
Tracking being added
5 · collapse pointDeep
Retention
People who signed up alone stayed alone
6Shallow
Free to paid
Tracking being added
05 · Design metrics
Hypotheses a test can disprove.
Under each driver sit two to four design metrics. Each had to pass three tests:
- Design can move it.
- It explains the driver above it.
- It can be counted now, or once tracking is added.
| Hypothesis | Disproved if |
|---|---|
| Sign-up start: visitors can’t tell what the product does for them before the call to action | The click rate stays flat after the hero is made explicit |
| Mobile: phones start sign-up at under half the desktop rate because there is no path shaped for a phone | The phone start rate doesn’t close on desktop once that path exists |
What sits under one driver
Driver 2
Sign-up start4 in 100 visitors start sign-up
Design metrics
CTA click rate
Clicks on the main call to action ÷ landing-page visitors
Needs a tracking goal
Section reach
Visitors who reach the workflow steps and the pricing block
Needs a tracking goal
Bounce by source
Bounce rate, split by where the visitor came from
Countable now
What design can change
- The hero message
- Where the call to action sits
- A visible price before the fold
- Proof from a real creator
The first hypothesis led straight to the landing page rebuild, which is its own case study.
06 · Decide
A cheap rule for what gets built.
Alongside the tree I proposed how to decide whether a feature is worth building, and a single place to collect user feedback so decisions can lean on it.
Outcome
The plan was accepted, and the area became mine.
- I own the metrics. I track the six numbers, add the missing tracking and am building the dashboard for them.
- The first fixes shipped. The landing page was rebuilt and instrumented, and the sign-up flow was rebuilt on my recommendations.
- I track the six numbers weekly, against the company’s monthly targets. In the spring we review the set itself and may choose different things to measure.
I delivered it as a written document, a slide deck and a live walkthrough with the team.
“Beyond her eye for detail for user experience and bugs, what I valued most was her judgement. She would push back when a design wasn’t right for users and back it up with evidence, and she was just as quick to change course when the data pointed the other way.”
Reflection
What I’d do differently.
- Get every data source before reading the numbers. A single source gives a partial picture. I now ask for all of them at the start.
- Next: finish the missing tracking, build the dashboard, and track the six numbers every week against the monthly targets.